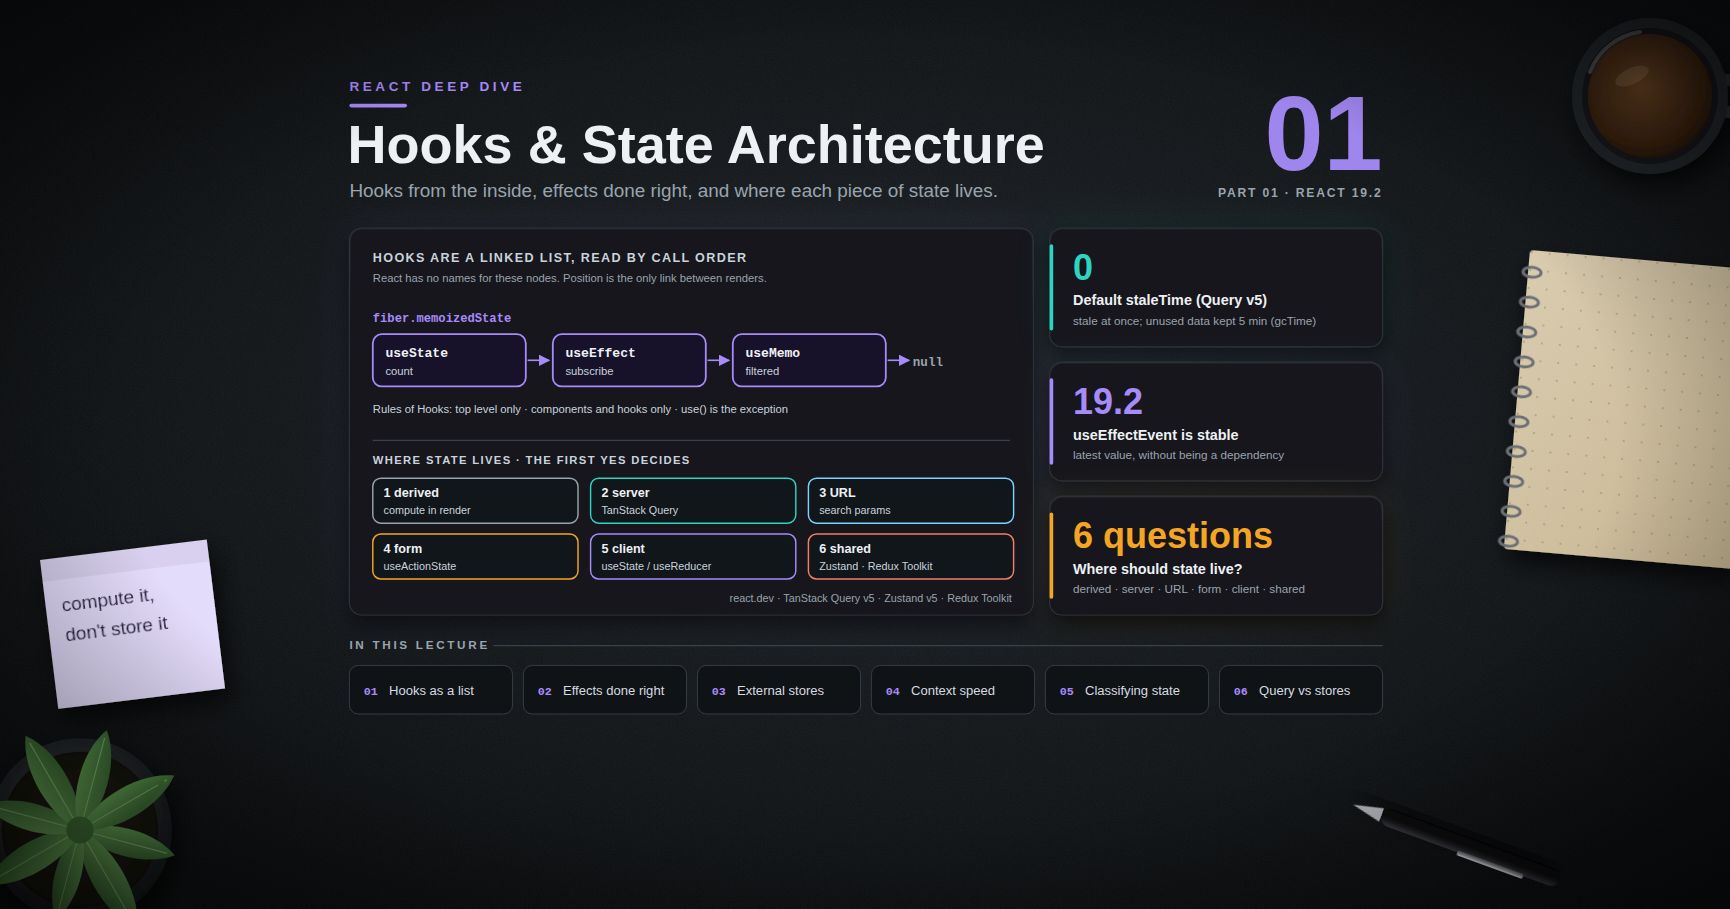
JavaScript Deep Dive — 00 · Engines & Runtime
JavaScript is not "interpreted" and not "compiled" — in a modern engine it is both, several times over, and the engine changes its mind while your code runs. A function starts as bytecode, gets promoted to machine code when it turns hot, gets thrown back to bytecode when one of the guesses behind that machine code turns out wrong, and all the while a garbage collector moves its objects around in memory. Almost every "mysterious" performance cliff in a senior engineer's career — the loop that is fast on Monday and five times slower after a harmless refactor, the service whose p99 latency spikes every few seconds — comes from this machinery. This first post of the series opens up V8, the engine behind Chrome, Edge, Node.js and Deno: its compiler tiers, hidden classes, inline caches, deoptimization, elements kinds and the Orinoco garbage collector, then places the engine inside the runtimes that host it.
Series map: 00 Engines & Runtime (this post) → 01 Event Loop & Concurrency → 02 Objects, Prototypes & Metaprogramming → 03 Async Engineering → 04 Modules, Packaging & TypeScript at Scale → 05 Performance, Memory & Production Debugging. Future: see the extensions table in 05.
Learning Outcome
- Separate the engine (ECMAScript) from the host (event loop, I/O, DOM,
fs) and say which one owns a given behaviour. - Trace a function through V8's pipeline: parser, Ignition bytecode, Sparkplug, Maglev, TurboFan, and back down on deoptimization.
- Explain hidden classes (V8 "maps"), shape transitions and dictionary mode, and write object code that keeps shapes stable.
- Classify an inline cache as monomorphic, polymorphic or megamorphic, and predict the cost of each.
- Read
--trace-deoptoutput and name the common reasons a function deoptimizes. - Use elements kinds to explain why
new Array(n)and a stray-0can slow a hot array loop. - Describe the Orinoco GC: scavenger, mark-compact, concurrent marking, write barriers — and read a
--trace-gcline. - Compare browser engines and server runtimes (Node.js, Deno, Bun, Workers) at the architecture level.
Chapter 1 — Engine vs host
Terminology
- Engine — implements the ECMAScript specification: parsing, the object model, built-ins such as
ArrayandPromise, and the job queue for promise reactions. V8, SpiderMonkey and JavaScriptCore are engines. - Host (embedder) — the program that embeds the engine and gives it a world: the event loop, timers, networking, the DOM, the file system. Chrome's Blink, Node.js, Deno, Bun and Cloudflare's
workerdare hosts. - Isolate — one independent V8 heap with its own garbage collector. A browser tab's main thread, each Web Worker and each Node
worker_threadsworker run in separate isolates. Isolates share no JavaScript objects. - Realm — one set of global objects and built-ins (
globalThis,Array,Object.prototype). An<iframe>is a new realm in the same isolate, which is whyarr instanceof Arrayfails for an array from another frame whileArray.isArray(arr)does not. - Job — the specification's word for a queued unit of work. The engine asks the host to schedule promise jobs (
HostEnqueuePromiseJob); the host decides when they run. That is why microtask timing is defined by HTML and Node, not by ECMAScript alone.
The split matters in practice because the specification says nothing about setTimeout, fetch, process.nextTick, require or the DOM. When behaviour differs between Chrome and Node, the engine is usually identical (both V8) and the host is the difference.
The landscape
| Environment | Engine | Host written in | Event loop | Notes |
|---|---|---|---|---|
| Chrome, Edge | V8 | C++ (Blink) | HTML event loop | Engine tiers covered in this post |
| Firefox | SpiderMonkey | C++ (Gecko) | HTML event loop | Tiers: interpreter, Baseline Interpreter, Baseline JIT, WarpMonkey (Warp) |
| Safari | JavaScriptCore | C++ (WebKit) | HTML event loop | Tiers: LLInt, Baseline, DFG, FTL |
| Node.js | V8 | C++ | libuv (phases, Post 01) | npm ecosystem, CommonJS + ESM |
| Deno | V8 | Rust | Tokio-based | Permissions model, web-standard APIs first |
| Bun | JavaScriptCore | Zig and C++ | Its own loop | Bundler, test runner and package manager in one binary |
| Cloudflare Workers | V8 isolates | C++ (workerd) |
Per-request | Many isolates per process instead of one process per app |
Server runtimes converge on web APIs (fetch, Request, Response, URL, ReadableStream, AbortController, structuredClone). That work is standardised by WinterTC (Ecma TC55), which took over from the W3C WinterCG community group in early 2025 and maintains a Minimum Common API for server runtimes.
Trick: when a library says "works in Node, Deno, Bun and Workers", it usually means "uses only the Minimum Common API plus ECMAScript". That is the portable subset to target for shared code such as validation, date handling or API clients.
Chapter 2 — The V8 pipeline
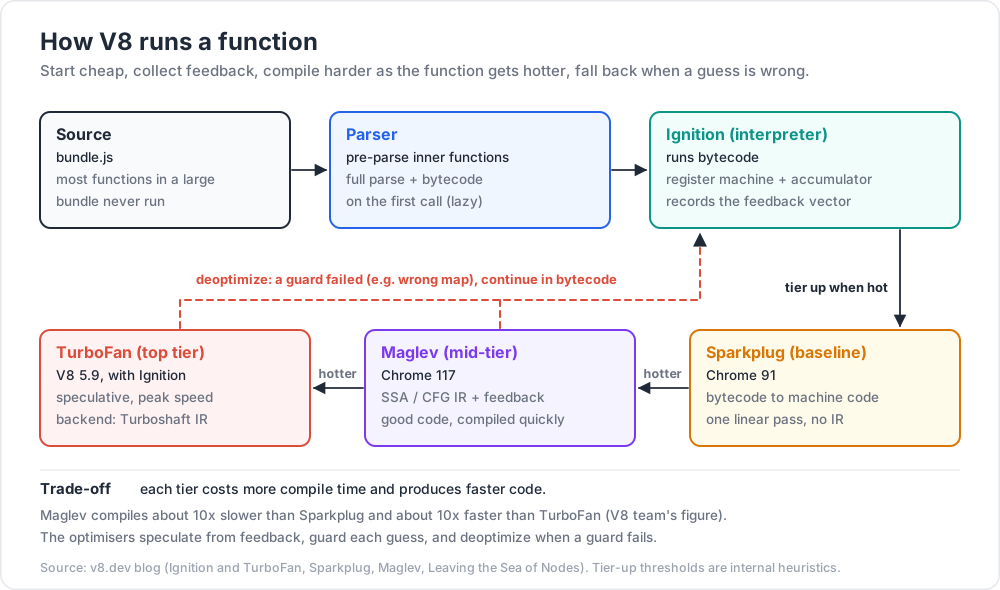
V8 has one interpreter and three compilers. Each tier trades compile time for code quality:
| Tier | Kind | Shipped | Input → output | Why it exists |
|---|---|---|---|---|
| Ignition | Interpreter | V8 5.9 / Chrome 59 (with TurboFan) | Source → bytecode, then executes it | Fast start, small memory, collects type feedback |
| Sparkplug | Baseline (non-optimising) compiler | Chrome 91 | Bytecode → machine code in one linear pass, no IR | Removes interpreter dispatch cost almost for free |
| Maglev | Mid-tier optimising compiler | Chrome 117 | Bytecode + feedback → SSA/CFG IR → machine code | Good code quickly: about 10× slower to compile than Sparkplug, about 10× faster than TurboFan (V8 team's figure) |
| TurboFan | Top-tier optimising compiler | V8 5.9 | Bytecode + feedback → heavily optimised machine code | Peak speed for truly hot code; its JavaScript backend now runs on the CFG-based Turboshaft IR |
Parsing: most functions are parsed twice
Full parsing is expensive, and most functions in a large bundle never run. V8 therefore pre-parses inner functions: it checks syntax and records which variables they capture, but builds no AST and no bytecode. The full parse and bytecode generation happen on the first call ("lazy compilation"). A function that is called immediately pays twice, so V8 uses heuristics — for example a function expression wrapped in parentheses ((function () { … })()) is compiled eagerly.
Consequences:
- Startup cost is dominated by how much code is parsed, not how much exists. Code splitting and lazy
import()help because unparsed code costs nothing. - Compiled bytecode can be cached. Chrome caches it for scripts it sees repeatedly; Node offers a module compile cache (
NODE_COMPILE_CACHE=dir, added in v22.1.0) that persists it to disk between runs, useful for CLIs.
Ignition: bytecode and feedback
Ignition is a register machine with a special accumulator register. You can print the bytecode of any function:
1
2
3
4
// bc.js
function add(p) { return p.x + p.y; }
add({ x: 1, y: 2 });
1
2
3
4
5
6
7
8
9
$ node --print-bytecode --print-bytecode-filter=add bc.js
Parameter count 2
Register count 1
GetNamedProperty a0, [0], [1] ; acc = p.x (feedback slot 1)
Star0 ; r0 = acc
GetNamedProperty a0, [1], [3] ; acc = p.y (feedback slot 3)
Add r0, [0] ; acc = r0 + acc (feedback slot 0)
Return
(Output trimmed and annotated; taken from Node 22 / V8 12.4. Opcode names change between V8 versions.)
The bracketed numbers after each operation are feedback slots. Every property access, call and arithmetic operation records what it saw — which object shapes, whether the operands were small integers or doubles — into the function's feedback vector. Everything the optimising tiers do is built on this record. Code that never ran has no feedback, and the optimisers cannot specialise it.
Tiering up and OSR
V8 counts how much a function runs (invocations and loop iterations, weighted by bytecode size) and promotes it when budgets run out. The exact thresholds are internal heuristics that change between releases; do not design around numbers.
A long-running loop inside a function that is called only once would never tier up by call count, so V8 performs on-stack replacement (OSR): it compiles an optimised version while the loop is running and jumps into it mid-loop.
Watch out: Node's defaults do not always match Chrome's. Chrome has enabled Maglev since M117, but at least one Node 22 release line ships with
--no-maglevas the default. Check your own binary withnode --v8-options | grep -A1 ' --maglev 'before assuming a tier exists.
Speculation is the whole trick
An optimising compiler for a dynamic language cannot know that p.x is a small integer. It speculates from feedback: "every p seen so far had shape M1, and p.x was always a Smi". It emits a cheap check (a guard) followed by a fast path — a load at a fixed offset, an integer add. If the guard fails at run time, the optimised code cannot continue; it deoptimizes (Chapter 5). Fast JavaScript is JavaScript whose guards rarely fail.
Chapter 3 — Hidden classes (maps)
Terminology
- Map (V8's term; "hidden class" or shape elsewhere) — a descriptor attached to every heap object that records its property names, their order, their attributes and where each value is stored.
- Transition — the edge from one map to another when a property is added. Maps form a transition tree rooted at the empty object's map.
- In-object property — a value stored directly inside the object's memory; the fastest kind of access.
- Properties backing store — an out-of-line array for properties that did not fit in-object.
- Dictionary mode ("slow properties") — the object drops its map-based layout and stores properties in a hash table.
How shapes are built
1
2
3
4
5
6
7
function Point(x, y) {
this.x = x; // map M0 (empty) -> M1 {x}
this.y = y; // map M1 -> M2 {x, y}
}
const a = new Point(1, 2);
const b = new Point(3, 4); // follows the same transitions: same map M2
Two objects share a map only if they received the same properties in the same order from the same starting point. You can check this with V8's internal functions (debugging only, never in production):
1
2
3
4
5
6
7
8
9
10
11
12
// node --allow-natives-syntax shapes.js
const a = new Point(1, 2), b = new Point(3, 4);
%HaveSameMap(a, b); // true
const c = new Point(1, 2); c.z = 3;
%HaveSameMap(a, c); // false: one more transition
%HaveSameMap({ x: 1, y: 2 }, { y: 2, x: 1 }); // false: order matters
const d = new Point(1, 2); delete d.x;
%HasFastProperties(d); // false: dictionary mode
const f = new Point(1, 2); f.x = undefined;
%HasFastProperties(f); // true: shape unchanged
(Results from Node 22 / V8 12.4.)
For constructors and classes, V8 uses slack tracking: the first objects created get extra in-object space, and after a number of constructions V8 shrinks the allocation to what was actually used. Properties added long after construction end up in the out-of-line backing store — still fast, one extra pointer hop.
Rules that keep shapes stable
- Initialise every field in the constructor (or as a class field), in the same order, even if the value is
null. An object that gainsthis.cachelater in some code paths splits the transition tree. - Do not
deleteproperties on hot objects. Set them toundefinedornull.deleteusually sends the object to dictionary mode for good (shown above). - Use
Mapfor dictionaries. An object used as a hash table with arbitrary keys will go to dictionary mode anyway, and thenObject.keysandfor…inare slower thanMapiteration. - Keep numeric field types consistent. A field that holds Smis in some objects and doubles in others forces the map to generalise the field's representation.
- Do not mutate prototypes of live objects (
Object.setPrototypeOf, assigning__proto__). Prototype maps are special; changing them invalidates optimised code that depended on them.
Common pitfall: "optional" fields added by spreading different objects:
{ ...base, ...(flag ? { extra: 1 } : {}) }creates two shapes from one call site. In a hot path, write{ ...base, extra: flag ? 1 : undefined }so every result has the same keys in the same order.
Chapter 4 — Inline caches and polymorphism
An inline cache (IC) is the feedback slot of one property access or call site. It remembers which maps it has seen and, for each, where the property lives.
| IC state | Maps seen | What the fast path does | Optimisable? |
|---|---|---|---|
| Uninitialised | 0 | Nothing yet; the access has not run | No feedback, the optimiser inserts a deopt point |
| Monomorphic | 1 | One map check, then a load at a known offset | Best case |
| Polymorphic | 2–4 | A short chain of map checks | Yes, slightly slower per extra map |
| Megamorphic | more than 4 | Gives up per-site caching; uses a global stub cache (hash table) | TurboFan cannot inline the access |
The cut-off is 4 maps in V8. A one-off measurement on Node 22 (V8 12.4, x86-64 cloud VM) with the script below shows the step clearly — about 26 ms with 1 shape, 47 ms with 4, and 114 ms with 5. Treat these as one run on one machine, not a benchmark result; the shape of the curve is what matters.
1
2
3
4
5
6
7
8
9
10
11
12
13
14
// poly.js — run each case in a fresh process: `for n in 1 2 4 5 8; do node poly.js $n; done`
const n = Number(process.argv[2] ?? 1);
function getX(o) { return o.x; }
const objs = [];
for (let i = 0; i < 1000; i++) {
const o = { x: i };
o['p' + (i % n)] = 0; // n distinct hidden classes, all with x first
objs.push(o);
}
let sum = 0;
const t0 = performance.now();
for (let r = 0; r < 20000; r++) for (let i = 0; i < objs.length; i++) sum += getX(objs[i]);
console.log(`${n} shapes: ${(performance.now() - t0).toFixed(0)} ms`, sum > 0);
Watch out: feedback belongs to the function, not to your benchmark case. Running several cases one after another through the same
getXin one process gives nonsense, because the IC accumulates every shape it has ever seen. Isolate cases in separate processes.
Where megamorphism comes from in real code
- Generic utilities — a
get(obj, path)helper, a deep-equal, a serializer, a logger'sformat(entry)— see every shape in the program. They are megamorphic by design. That is acceptable if they are not your hot loop. - Component frameworks — a renderer that reads
props.childrenon thousands of different component prop objects. Framework authors work hard to keep internal objects (fibers, vnodes) one shape, and you should keep your own hot records the same way. - Heterogeneous arrays — an array of events where each type is a differently shaped object. Consider a single shape with a
typetag and the same fields (somenull) for the hot processing path. - Class hierarchies — instances of different subclasses have different maps. A loop over
Shape[]callingarea()is polymorphic in the call site; with more than four subclasses it goes megamorphic.
Trick: normalise at the boundary. Parse external data (JSON, database rows) into objects created by one factory or class with a fixed field order. The rest of the program then sees one map.
Chapter 5 — Deoptimization
When a guard in optimised code fails, V8 reconstructs the interpreter frame from the optimised frame (the compiler keeps metadata for this) and continues in Ignition or Sparkplug. The function can be optimised again later with the new feedback.
| Kind | Trigger | Example |
|---|---|---|
| Eager | A guard fails inside optimised code | add was optimised for {x, y} Smis, then receives a string |
| Lazy | An assumption is invalidated elsewhere; the code is marked and deopts when control returns to it | Someone modifies a prototype or a constant field that the code depended on |
| Soft | The optimiser reached code that had no feedback yet | A branch that never ran before optimisation |
Watching it happen:
1
2
3
4
5
6
7
8
// deopt.js — node --allow-natives-syntax --trace-deopt deopt.js
function add(p) { return p.x + p.y; }
%PrepareFunctionForOptimization(add);
add({ x: 1, y: 2 }); add({ x: 1, y: 2 });
%OptimizeFunctionOnNextCall(add);
add({ x: 1, y: 2 }); // optimised for map {x, y}
add({ x: 'a', y: 2, z: 1 }); // different map -> guard fails
1
2
[bailout (kind: deopt-eager, reason: wrong map): begin. deoptimizing … <JSFunction add …>, … <Code TURBOFAN>, opt id 0, bytecode offset 0, …]
The two fields to read are kind and reason. Common reasons: wrong map (shape changed), not a Smi / lost precision (number representation changed), out of bounds (array index past length), wrong call target, Insufficient type feedback.
Failure modes
- Deopt loops. A function optimises, deopts, re-optimises with slightly wider feedback, deopts again. Each round throws away compile work, and the function spends much of its life in the lower tiers. The symptom is a function that stays slow however hot it is.
--trace-opt --trace-deoptshows the cycle. - One-time deopts are normal. A few at startup cost microseconds. Chase deopts only when a profile shows the function is hot and the trace shows repetition.
- Stale advice. "
try/catchdisables optimisation" and "never usearguments" date from Crankshaft, the compiler TurboFan replaced in 2017. TurboFan optimisestry/catch. Rest parameters are still clearer thanarguments, but for readability, not speed.
Measuring without fooling yourself
Microbenchmarks in a JIT are hazardous:
- Warm-up. The first iterations run in Ignition. Measure after warm-up, or measure a realistic workload end to end.
- Dead-code elimination. If the result is unused, TurboFan may delete the work. Always consume the result (the
sum > 0above). - Constant folding. Inputs known at compile time can be folded away. Take inputs from
process.argvor data. - Feedback pollution. Covered above: separate processes per case.
- GC noise. An allocation-heavy loop measures the garbage collector as much as your code. Run several times and report the spread.
Trick: use
%natives only to explain a result you have already measured, never in shipped code. They are internal, unstable and disabled without--allow-natives-syntax.
Chapter 6 — Numbers and elements kinds
Smis and heap numbers
V8 represents small integers as Smis — tagged values stored directly in the pointer, with no allocation. With pointer compression (Chrome on 64-bit) a Smi is 31 bits (−2³⁰ to 2³⁰−1); builds without pointer compression, typical for Node, use 32-bit Smis on 64-bit platforms. Anything else — fractions, -0, NaN, Infinity, integers outside the Smi range — is a HeapNumber (a boxed double), unless the optimiser can keep it unboxed in a register or a double field.
Elements kinds
Array-indexed properties (the elements) are tracked separately from named properties, with their own "kind". V8 distinguishes 21 elements kinds; the six you meet daily form a lattice:
1
2
3
4
PACKED_SMI_ELEMENTS → PACKED_DOUBLE_ELEMENTS → PACKED_ELEMENTS
↓ ↓ ↓
HOLEY_SMI_ELEMENTS → HOLEY_DOUBLE_ELEMENTS → HOLEY_ELEMENTS
Transitions only go right or down, towards more general kinds — never back:
1
2
3
4
5
6
const a = [1, 2, 3]; // PACKED_SMI_ELEMENTS
a.push(4.56); // PACKED_DOUBLE_ELEMENTS
a.push('x'); // PACKED_ELEMENTS
a[9] = 1; // HOLEY_ELEMENTS (indices 5-8 are holes) - holey forever,
// even if you later fill every hole
Why holes cost: reading a hole means "not here — look up the prototype chain", so every holey read needs an extra check, and the engine must be sure nobody added indexed properties to Array.prototype or Object.prototype.
Practical rules (from the V8 team's own guidance):
- Prefer literals and
pushovernew Array(n), which creates a holey array. If you need a pre-sized numeric buffer, use a typed array (new Float64Array(n)), which has no holes and a fixed element type. - Keep
-0,NaNandInfinityout of integer arrays unless they are real data; one such value turns a Smi array into a double array. - Do not read past
length(while (arr[i] != null)style loops); an out-of-bounds read walks the prototype chain and can deopt. - Convert array-likes (
arguments,NodeList) to real arrays once, then loop over the array.
Common pitfall:
Array(n).fill(0)is still HOLEY_SMI_ELEMENTS —fillputs values in the holes but the array stays holey (holey is permanent).Array.from({ length: n }, () => 0)builds a packed array. The difference only matters in genuinely hot numeric code; do not rewrite ordinary code for it.
Chapter 7 — The Orinoco garbage collector
Terminology
- Generational hypothesis — most objects die young. A GC that collects young objects often and cheaply wins.
- Young generation — where new objects are allocated. In V8 it is split into a nursery and an intermediate generation.
- Old generation — objects that survived two young collections.
- Scavenge (minor GC) — copying collection of the young generation.
- Mark-Compact (major GC) — marking live objects in the whole heap, sweeping dead ones, compacting fragmented pages.
- Write barrier — a small piece of code the engine runs on every pointer store into the heap, so concurrent or incremental marking does not miss new references, and old-to-young pointers are remembered.
- Stop-the-world pause — time the main thread spends in GC instead of running JavaScript.
Young generation: the scavenger
New objects go into the nursery with bump-pointer allocation (very cheap). When the young space fills, a scavenge copies live objects out: survivors of their first scavenge become intermediate; survivors of a second are promoted to the old generation. The young generation uses a semi-space design, so half of it is always empty to receive the copies. Cost is proportional to the number of live objects, not the garbage — dying young is nearly free.
The scavenger runs in parallel on helper threads; the V8 team measured a 20–50% reduction in main-thread young-generation GC time from parallel scavenging.
Node exposes the size knob: --max-semi-space-size (MiB). The Node docs note that the young generation is three times the semi-space size, so +1 MiB of semi-space adds 3 MiB of heap. Raising it can cut scavenges for allocation-heavy servers; benchmark before and after.
Old generation: concurrent mark-compact
- Marking finds everything reachable from the roots (stack, globals, handles). V8 does most of it concurrently on background threads while JavaScript runs, plus incremental steps on the main thread. Write barriers keep it correct while your code mutates the heap.
- Sweeping frees dead objects' memory into free lists, concurrently.
- Compaction moves objects out of fragmented pages, in parallel, during a pause.
- Large objects (above a size threshold) live in a separate large-object space and are never moved.
- Idle-time GC: the browser tells V8 when a frame finished early, and V8 uses the idle slice for GC work.
Concurrent marking and sweeping reduced pause times in heavy WebGL games by up to 50%, per the V8 team.
In Chrome, Blink's C++ DOM objects are managed by Oilpan (cppgc) and traced together with the JavaScript heap, so a cycle between a DOM node and a JavaScript closure is still collectable.
Reading --trace-gc
1
2
3
4
$ node --trace-gc app.js
[1394:0x369ad000] 24 ms: Scavenge 4.4 (5.1) -> 3.7 (6.1) MB, pooled: 0 MB, 0.90 / 0.00 ms (average mu = 1.000, current mu = 1.000) allocation failure;
[1429:0x15ff8000] 233 ms: Mark-Compact 65.2 (91.0) -> 51.7 (85.5) MB, pooled: 0 MB, 70.24 / 0.00 ms (+ 2.5 ms in 0 steps since start of marking, …) (average mu = 0.682, current mu = 0.682) finalize incremental marking via stack guard; GC in old space requested
| Field | Meaning |
|---|---|
Scavenge / Mark-Compact |
Minor or major GC |
4.4 (5.1) -> 3.7 (6.1) MB |
Used heap (committed heap) before → after |
0.90 / 0.00 ms |
Main-thread pause / time spent in external (embedder) callbacks |
mu |
Mutator utilisation: the fraction of time spent running JavaScript rather than GC. 1.000 is perfect |
| trailing text | Why it ran: allocation failure (young space full) is the normal reason |
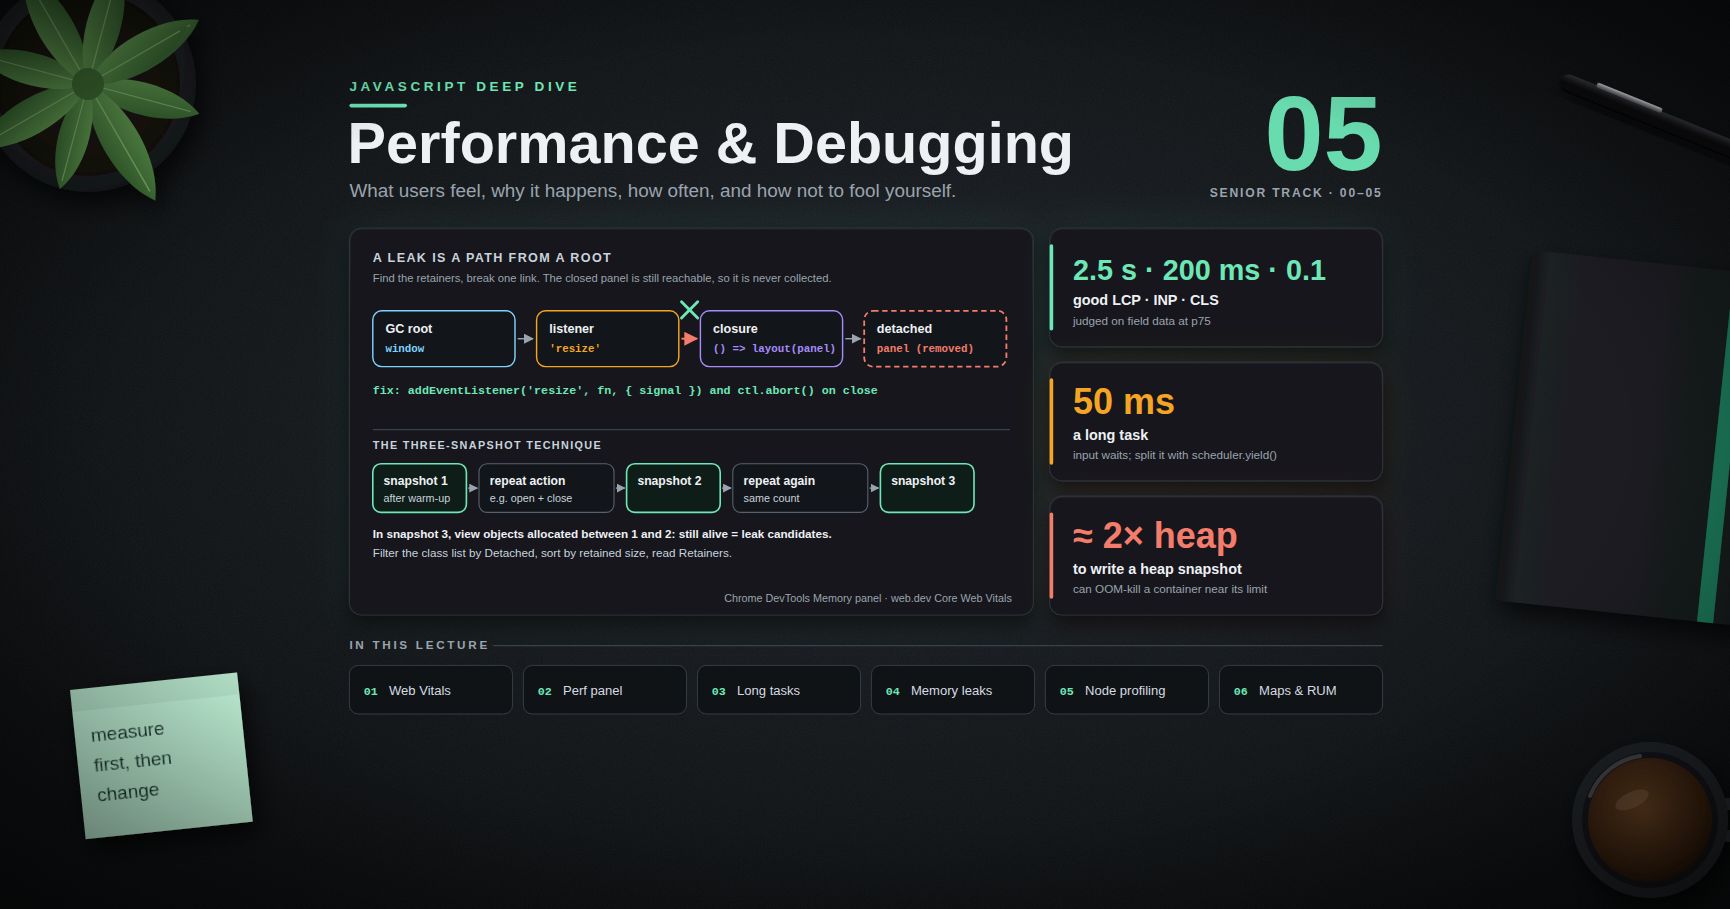
Healthy services show frequent sub-millisecond scavenges and rare mark-compacts. Warning signs: mark-compacts that free little memory (232.8 -> 200.3 after a 224 ms pause is a heap full of live data), mu trending down, and heap "after" values that climb from one major GC to the next — a leak, which Post 05 hunts with heap snapshots.
Watch out:
--max-old-space-sizeis a ceiling, not a target. Setting it above the container's memory limit lets the heap grow until the kernel OOM-kills the process instead of V8 throwing a clean "heap out of memory". Set it below the container limit, leaving room for buffers, native memory and the young generation.
Practice Exercises
Exercise 1 — Engine or host?
For each, say whether the engine or the host defines it: (a) Array.prototype.map, (b) setTimeout, (c) the order of promise then callbacks relative to each other, (d) when promise callbacks run relative to a click event, (e) structuredClone, (f) import() resolving a bare specifier like "react".
Solution
(a) Engine — ECMAScript built-in. (b) Host — HTML / Node timers. (c) Engine — the spec requires promise jobs to run in the order they were enqueued. (d) Host — HTML decides when it performs a microtask checkpoint. (e) Host — defined by the HTML standard, adopted by server runtimes. (f) Both: import() syntax and module semantics are ECMAScript, but resolving a specifier to a file or URL is host-defined (Node's resolution algorithm, a browser import map).
Exercise 2 — Predict the maps
How many distinct maps end up in list?
1
2
3
4
5
6
7
8
const list = [];
for (let i = 0; i < 6; i++) {
const o = { id: i };
if (i % 2) o.name = 'odd';
if (i % 3 === 0) o.tag = 'three';
list.push(o);
}
Solution
List the property sequences: i=0 {id, tag}, i=1 {id, name}, i=2 {id}, i=3 {id, name, tag}, i=4 {id}, i=5 {id, name}. Distinct: {id}, {id, name}, {id, tag}, {id, name, tag} — four maps. A function reading o.id across this list is polymorphic (4 maps, the limit). Add one more optional field and it goes megamorphic. Fix: const o = { id: i, name: i % 2 ? 'odd' : null, tag: i % 3 === 0 ? 'three' : null }; gives one map.
Exercise 3 — Reproduce the megamorphic step
Run poly.js from Chapter 4 for n = 1, 2, 3, 4, 5, 6 on your machine. Where is the jump? Then change getX to read a property added after the varying one (o.q = 1 after the loop line, read o.q). Does anything change?
Solution
The jump appears between 4 and 5 shapes, where the IC turns megamorphic. Reading q instead of x still sees n maps (the maps differ because of the earlier varying property), so the curve is the same. Map identity depends on the whole transition path, not just the property being read.
Exercise 4 — Read a deopt
A trace shows kind: deopt-eager, reason: not a Smi repeating every few seconds for computeTotal. What changed in the data, and what are two fixes?
Solution
computeTotal was optimised on feedback that a value was always a small integer; now it periodically receives a fraction or a large integer (e.g. a price like 19.99, or an ID above the Smi range). Fixes: (1) make the representation consistent from the start — e.g. keep money in integer cents, or ensure warm-up covers doubles so the optimiser plans for them; (2) stop mixing types — parse values to numbers once at the boundary instead of sometimes receiving strings. Repeating deopts point to a deopt loop; confirm with --trace-opt --trace-deopt.
Exercise 5 — Elements kinds
Give the elements kind after each line: const a = new Array(3); · a[0] = 1; a[1] = 2; a[2] = 3; · const b = [1, 2, 3].map(x => x / 2); · const c = [1, 2, 3]; c.push(-0);
Solution
new Array(3) → HOLEY_SMI_ELEMENTS. Filling all three slots → still HOLEY_SMI_ELEMENTS (holey is permanent). b → PACKED_DOUBLE_ELEMENTS (map builds a fresh packed array; 0.5 and 1.5 are doubles). c.push(-0) → PACKED_DOUBLE_ELEMENTS, because -0 cannot be a Smi.
Exercise 6 — Diagnose a GC trace
A Node API in a 1 GiB container runs with --max-old-space-size=4096. Under load, --trace-gc shows Mark-Compact lines every few seconds, each pausing 300–600 ms and freeing under 5% of the heap; then the pod restarts with exit code 137. Explain and fix.
Solution
The heap is mostly live data (a leak or an unbounded cache), so each major GC works hard and frees little, and pauses grow with heap size. Because the V8 limit (4096 MiB) is above the container limit (1 GiB), V8 never throws "heap out of memory"; the kernel's OOM killer ends the process (137 = SIGKILL). Fix: set --max-old-space-size below the container limit (for example around 700–768 MiB for 1 GiB, leaving room for native memory) so failures are visible and diagnosable, then find the retained objects with heap snapshots (Post 05) — usually an unbounded Map, a listener that is never removed, or closures captured in a global.
Cheat-sheet
| What | How |
|---|---|
| V8 tiers | Ignition (bytecode) → Sparkplug (baseline) → Maglev (mid) → TurboFan (top) |
| Print bytecode | node --print-bytecode --print-bytecode-filter=fn app.js |
| Watch optimisation | node --trace-opt --trace-deopt app.js |
| Check a flag's default | node --v8-options | grep -A1 ' --maglev ' |
| Same shape? (debug only) | node --allow-natives-syntax, then %HaveSameMap(a, b) |
| Stable shapes | All fields in constructor, same order; no delete; Map for dictionaries |
| IC states | 1 map mono · 2–4 poly · more than 4 megamorphic |
| Deopt kinds | Eager (guard fails) · Lazy (assumption broken elsewhere) · Soft (no feedback) |
| Fast arrays | Literals / push; avoid holes, -0, NaN; typed arrays for numeric buffers |
| GC trace | node --trace-gc app.js |
| Young-gen size | --max-semi-space-size=MiB (young gen = 3 × semi-space) |
| Old-gen ceiling | --max-old-space-size=MiB, below the container limit |
| Startup cache | NODE_COMPILE_CACHE=dir (Node 22.1+) |
| Portable server API | WinterTC Minimum Common API |
What's next
Post 01 moves from the engine to the host: the event loop. The call stack, tasks and microtasks, where rendering and requestAnimationFrame fit in a browser frame, output-ordering puzzles that trip up senior interviews, Node's libuv phases with process.nextTick and setImmediate, and real parallelism with Web Workers, worker_threads, SharedArrayBuffer and Atomics.
References
- V8 blog — Launching Ignition and TurboFan — the 2017 pipeline change.
- V8 blog — Sparkplug, a non-optimizing JavaScript compiler
- V8 blog — Maglev, V8's fastest optimizing JIT
- V8 blog — Land ahoy: leaving the Sea of Nodes — Turboshaft.
- V8 blog — Fast properties in V8 — in-object, fast and dictionary properties.
- V8 blog — Elements kinds in V8
- V8 blog — Trash talk: the Orinoco garbage collector
- Mathias Bynens & Benedikt Meurer — JavaScript engine fundamentals: Shapes and Inline Caches
- Node.js CLI options —
--max-semi-space-size,--max-old-space-size,NODE_COMPILE_CACHE. - ECMAScript specification — Jobs and host operations
- WinterTC (Ecma TC55) — the Minimum Common API for server runtimes.