MongoDB Course — 15 · Performance Deep — WiredTiger, Working Set, Compression, MVCC, Hot Keys
You've indexed (Post 03), tuned queries (Post 04), sized the pool (Post 08), and put metrics in place (Post 14). When everything looks healthy but performance still isn't, the answer is one layer deeper — WiredTiger (the storage engine), the working-set vs cache relationship, document compression, MVCC + locks, and the patterns that produce hot keys + large-document problems. This post covers the in-depth performance knobs that decide whether a well-tuned cluster handles 10k QPS or 100k QPS.
Series map: 00 Foundations → … → 14 Backup & Ops → 15 Performance Deep (this post) → 16 Atlas → 17 Drivers & Case Studies.
Learning Outcome
- Explain WiredTiger cache + how the working set decides RAM sizing.
- Configure + compare snappy / zstd / zlib compression.
- Understand document-level locking + MVCC + ticket exhaustion.
- Recognise + fix hot-key / large-document / array-growth patterns.
- Use GridFS for files bigger than 16 MB.
- Diagnose with
serverStatus,db.stats(), FTDC.
Chapter 1 — WiredTiger cache
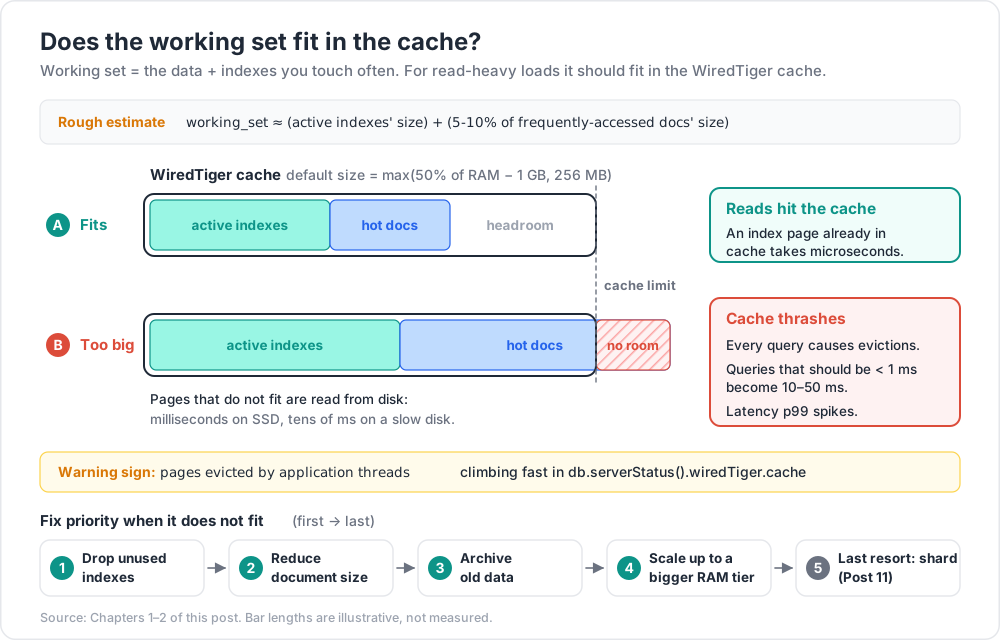
WiredTiger is MongoDB's default storage engine (since 3.2). It keeps recently-accessed B-tree pages + index entries in an in-memory cache:
- Default size:
max(50% of RAM - 1 GB, 256 MB). - Tunable:
storage.wiredTiger.engineConfig.cacheSizeGB.
1
2
3
4
5
storage:
wiredTiger:
engineConfig:
cacheSizeGB: 32
Cache holds:
- Indexes pages (priority).
- Recently-read document pages.
- Active write buffers.
Cache hit rate matters more than absolute RAM. A query touching an index page already in cache is microseconds. Touching one from disk is milliseconds (SSD) or tens of ms (slow disk).
Inspect:
1
2
db.serverStatus().wiredTiger.cache
Key fields:
bytes currently in the cachetracked dirty bytes in the cache(modified, not yet checkpointed)pages evicted by application threads— bad sign; app waited for evictionunmodified pages evicted— finemodified pages evicted— fine; happens periodically
If pages evicted by application threads is climbing fast, the cache is undersized for your working set.
Chapter 2 — Working set sizing — the most important number
The working set is "data + indexes you actually touch frequently". For read-heavy workloads, working set should fit in the WiredTiger cache.
Rough estimate:
1
2
working_set ≈ (active indexes' size) + (5-10% of frequently-accessed docs' size)
You can measure:
db.collection.stats()→size,totalIndexSize.$indexStats→ which indexes are actually used.
If working set > cache:
- Cache thrashes — every query causes evictions.
- Queries that should be < 1 ms become 10-50 ms.
- Latency p99 spikes.
Fix priority:
- Drop unused indexes.
- Reduce document size (don't store unused fields; compress text outside Mongo).
- Archive old data (Atlas Online Archive or manual move).
- Scale up to a bigger RAM tier.
- Last resort: shard (Post 11) — distributes working set across multiple machines.
Chapter 3 — Compression
WiredTiger compresses blocks before writing to disk. Three options, configurable per collection or globally:
| Codec | CPU | Ratio | When |
|---|---|---|---|
snappy (default) |
low | ~3× | balanced; default for collections |
zstd (5.0+) |
medium | ~4× | better ratio, modest CPU bump; modern default for new collections |
zlib |
high | ~5× | archival, cold data, CPU plentiful |
none |
none | 1× | rarely useful |
Per-collection at creation:
1
2
3
4
db.createCollection("orders", {
storageEngine: { wiredTiger: { configString: "block_compressor=zstd" } }
})
For most new collections in 2026, zstd beats snappy: similar speed, better compression → smaller cache footprint → higher hit rate.
Indexes are compressed by prefix compression separately (always on).
Trick: if your working set barely fits in RAM, switching from snappy → zstd often gives you 25 % more effective cache for free. Test under load before flipping in production.
Chapter 4 — Document-level locking + MVCC
WiredTiger uses multi-version concurrency control (MVCC):
- Readers see a consistent snapshot at their start time.
- Writers create new versions; old versions linger until no reader needs them.
- Locking is at the document level — different documents in the same collection don't block each other.
Practical implications:
- High concurrency on different documents = fine.
- High concurrency on the SAME document = serialised (hot-key problem, next).
- Long readers force old versions to linger → memory pressure.
No collection-level lock during ordinary CRUD. DDL (createIndex, drop, collMod) still locks the collection briefly.
Chapter 5 — Hot keys + write hotspots
Symptom: a small subset of documents (one user, one product, one counter) receives most writes. WiredTiger serialises writes per document. The cluster has spare capacity but that one document caps throughput.
Examples:
- A "global stats" doc incremented on every event.
- A celebrity user's profile updated by every fan's like.
- An auto-increment sequence counter.
Fixes:
- Sharded counter pattern — split one counter into N shards, increment a random one, sum on read:
1
2
3
4
5
6
7
8
9
10
11
12
13
14
// write
const shardId = Math.floor(Math.random() * 16);
db.counters.updateOne(
{ _id: `pageviews:${shardId}` },
{ $inc: { count: 1 } },
{ upsert: true }
);
// read
db.counters.aggregate([
{ $match: { _id: { $regex: "^pageviews:" } } },
{ $group: { _id: null, total: { $sum: "$count" } } }
])
-
Move to per-event docs — instead of incrementing a counter, insert one doc per event; aggregate on read. Trade write hotspot for storage + aggregation cost. Use TTL to bound storage.
-
Async aggregation — log raw events; a background job rolls them up periodically (change stream +
$merge).
Chapter 6 — Large-document anti-pattern
Documents have a 16 MB BSON ceiling. Approaching it brings problems even earlier:
- Every update rewrites (copy-on-write) the whole document — slow.
- Indexes on fields inside huge docs are inefficient.
- Network + WiredTiger cost grows.
Practical limit: keep docs under ~1 MB for hot writes.
Causes of bloat:
- Unbounded arrays — comments, followers, history.
- Embedded binary data — images, PDFs.
- Schema drift — old fields accumulating.
Fixes:
- Cap arrays:
$push: { items: { $each: [x], $slice: -100 } }. - Move to child collection.
- GridFS for large binary (Chapter 7).
- Compress before storing (gzip text), decompress on read.
For files that need to live in MongoDB, GridFS is the safer answer.
Chapter 7 — GridFS
GridFS splits large files into chunks (default 255 KB) stored across two collections (<bucket>.files + <bucket>.chunks).
1
2
3
4
5
6
7
8
9
10
11
12
import { GridFSBucket } from 'mongodb';
const bucket = new GridFSBucket(db, { bucketName: 'uploads' });
fs.createReadStream('big.mp4').pipe(
bucket.openUploadStream('big.mp4', { metadata: { uploader: 'ada' } })
);
bucket.openDownloadStreamByName('big.mp4').pipe(
fs.createWriteStream('downloaded.mp4')
);
Use GridFS when:
- Files > 16 MB.
- You want metadata + access control alongside the file in one system.
- Replication + sharding of the files for free.
Better alternatives (in 2026):
- S3 (or other object storage) + store URL + metadata in MongoDB. Cheaper, faster, scales further.
- GridFS is convenient for small projects; object storage wins at scale.
Chapter 8 — Concurrency tickets (recap from Post 08)
WiredTiger limits concurrent storage-engine operations via read + write tickets (default 128 each).
1
2
3
db.serverStatus().wiredTiger.concurrentTransactions
// { write: { out: 12, available: 116, totalTickets: 128 }, read: { ... } }
available near 0 = exhaustion → operations queue → latency spikes.
Causes:
- Slow queries holding tickets too long (most common).
- Sudden write storm exceeding capacity.
- Bad index plans.
Fix order:
- Find + fix slow queries (Post 04).
- Reduce app-side concurrency (smaller pool).
- Scale up.
Tickets aren't directly tunable in modern versions — they're sized by the storage engine.
Chapter 9 — Long readers + MVCC pressure
A long-running read holds an MVCC snapshot. Old document versions can't be reclaimed until the reader is done. Long readers + heavy writers = memory pressure (cache fills with version chains).
Symptoms: transactions.transaction store growing, cache evictions climbing during long-running aggregations.
Mitigations:
- Set
maxTimeMSon every user-facing query (Post 02). - Run heavy aggregations on a secondary (with
secondaryPreferred) to isolate. - Break long aggregations into chunked stages writing to a
$mergetarget.
Chapter 10 — Index-pages-in-RAM math
A useful sanity check:
1
2
3
hot_index_size = sum(index sizes used in hot queries)
ratio = hot_index_size / wiredtiger_cache
If ratio > 1, you can't keep indexes in RAM — queries that should be index-only will spill to disk.
Get sizes:
1
2
3
db.orders.totalIndexSize()
db.orders.stats().indexSizes
Add up the ones from $indexStats (Post 04) with non-trivial ops. That's your hot index footprint.
Chapter 11 — FTDC + diagnostic data
MongoDB writes Full-Time Diagnostic Data Capture files to dbpath/diagnostic.data/. Continuous metrics, queryable after the fact with tools like mongo-profiler + Atlas's built-in analyzer.
For self-hosted root-cause analysis:
- Capture FTDC during an incident; share with MongoDB support or analyse via OSS tools.
- Combine with mongod logs (slow ops, election events, ticket waits).
Atlas: FTDC is collected automatically; the Atlas team can access it for support cases.
Chapter 12 — Sample production tuning checklist
For a new self-hosted production cluster:
- [ ] WiredTiger cache sized to fit working set + headroom.
- [ ]
zstdcompression for cold-ish collections. - [ ] Indexes audited; unused dropped.
- [ ] Hot-counter pattern uses sharded counters.
- [ ] No collection-level arrays growing unbounded.
- [ ] Large binaries in GridFS or S3, not embedded.
- [ ]
maxTimeMSon user-facing queries. - [ ] Profiler at
slowms: 100. - [ ] FTDC retained for 30 days.
- [ ] Prometheus + Grafana dashboard alerting on the Post 14 metrics.
- [ ] Restore drill scheduled monthly.
Chapter 13 — Common pitfalls
| Pitfall | Symptom | Fix |
|---|---|---|
| Working set > RAM | latency spike under load; cache evictions high | scale RAM; drop indexes; archive old data |
| Hot key | one doc gets all writes; throughput capped | sharded counter pattern |
| Unbounded array | doc grows toward 16 MB | cap with $slice; move to child collection |
| Files in MongoDB | hot writes slow + GridFS overhead | S3 |
| Default snappy when zstd would fit better | larger on-disk footprint | switch (test first) |
| Long-running aggregation on primary | cache pressure | run on secondary; or $merge chunked |
| Ticket exhaustion | latency spike + tickets near 0 | fix slow queries first; reduce client concurrency |
| Index not in RAM | predictable slow queries | index pruning; bigger tier |
| Big update copy-on-write | slow updates on huge docs | shrink the doc; partial updates only of what changed |
Practice Exercises
Exercise 1 — Cache hit rate
Pull db.serverStatus().wiredTiger.cache before + after a synthetic workload. Compute the application-thread eviction rate. Increase load until the rate becomes alarming.
Exercise 2 — zstd vs snappy
Create two collections with identical schema, one snappy + one zstd. Insert 1M synthetic docs into each. Compare on-disk size (db.collection.stats()).
Exercise 3 — Hot counter remediation
Build a global page-view counter naively (one doc incremented). Stress it with 100 concurrent writers. Note the throughput plateau. Refactor to sharded counter pattern (Chapter 5). Repeat — should scale linearly.
Exercise 4 — GridFS round-trip
Upload a 200 MB file via GridFS. Download to a new path. Confirm checksum matches.
Exercise 5 — Capacity scenario
Given: 200 GB index across all hot collections; 64 GB RAM tier (WT cache ≈ 30 GB). Compute whether the working set fits. Recommend an action.
Cheat-sheet
| What | How |
|---|---|
| WT cache default | 50 % RAM − 1 GB |
| Inspect | db.serverStatus().wiredTiger.cache |
| App-thread evictions ↑ | working set > cache |
| Working set sizing | hot indexes + ~5-10 % hot docs |
| Compression options | snappy / zstd (recommended) / zlib / none |
| Per-collection compression | storageEngine.wiredTiger.configString |
| MVCC | per-doc; readers see consistent snapshot |
| Hot key fix | sharded-counter pattern |
| Array cap | $push: { $each: [x], $slice: -100 } |
| Large file | GridFS (or better: S3) |
| Tickets | 128 default; not directly tunable |
| Long reader pressure | maxTimeMS; run on secondary |
| Index size check | db.coll.stats().indexSizes |
| FTDC | dbpath/diagnostic.data/ |
| Production checklist | Chapter 12 |
What's next
Post 16 covers Atlas-only features — Atlas Search (Lucene-based full-text + facets + autocomplete), Atlas Vector Search (k-NN for embeddings — the RAG building block), Atlas Triggers (scheduled + database + auth + HTTP), Atlas Stream Processing, and Data Federation / Online Archive.
References
Note: this post is in progress. Planned additions: real workload benchmarks (snappy vs zstd); kernel
vm.swappiness=1; transparent huge pages disable script; NUMA-aware sizing.